Fragmented operations, invisible workflows
Enterprise facility management sits where people, assets and data meet. Facilio entered a market where 72% of commercial real estate assets were heavily mismanaged, held back by siloed systems, manual processes and no real-time visibility across portfolios.
Technicians
Unable to track task progress or close work orders digitally. Manual meter readings brought constant human error into the field.
Facility Managers
No unified view of technician workflows, asset performance or portfolio-level energy data. Dashboard customisation didn't exist.
Occupants
No dedicated portal to raise, track or get updates on maintenance requests. Communication gaps left issues unresolved.
B2B design complexity
Enterprise software brings design challenges far beyond consumer products. Surveys of over 3,000 enterprise designers found that keeping UX consistent is the single greatest challenge. Longer product cycles, multi-approval design decisions and constant pressure to ship new features over refining the experience make it harder.
Functional complexity
More data states, visualisations and multi-user collaboration.
Consistency at scale
Longer cycles cause component drift and inconsistent patterns.
Feature vs. experience
New features almost always take priority over UX improvements.
Research-led design thinking across all stakeholders
A team of four, led by a Senior Product Designer, took a structured, research-grounded approach before placing a single pixel. The mandate: improve the working lives of field technicians and facility managers by making sure planned and unplanned tasks run on time, with full visibility.
Proper planning & processes
Phased design sprints with cross-functional approval gates tied every decision to a validated user pain point. Early alignment between Product, Engineering and Design cut costly rework.
Design thinking & research
On-site observation with field technicians, structured interviews with facility managers and occupant journey mapping. Prioritisation was evidence-based, and the UX left nothing to guesswork.
Continuous improvement
A formal feedback loop between field usage data and design iterations, plus internal advocacy to win stakeholder investment in UX alongside new features.
Designing for real people
Three personas anchored every decision. Jake, the technician, does field work and logs readings. Cooper, the facility manager, approves requests, assigns orders and analyses portfolio performance. Alex, the occupant, pays bills, raises complaints and monitors consumption. One platform had to serve all three at once.
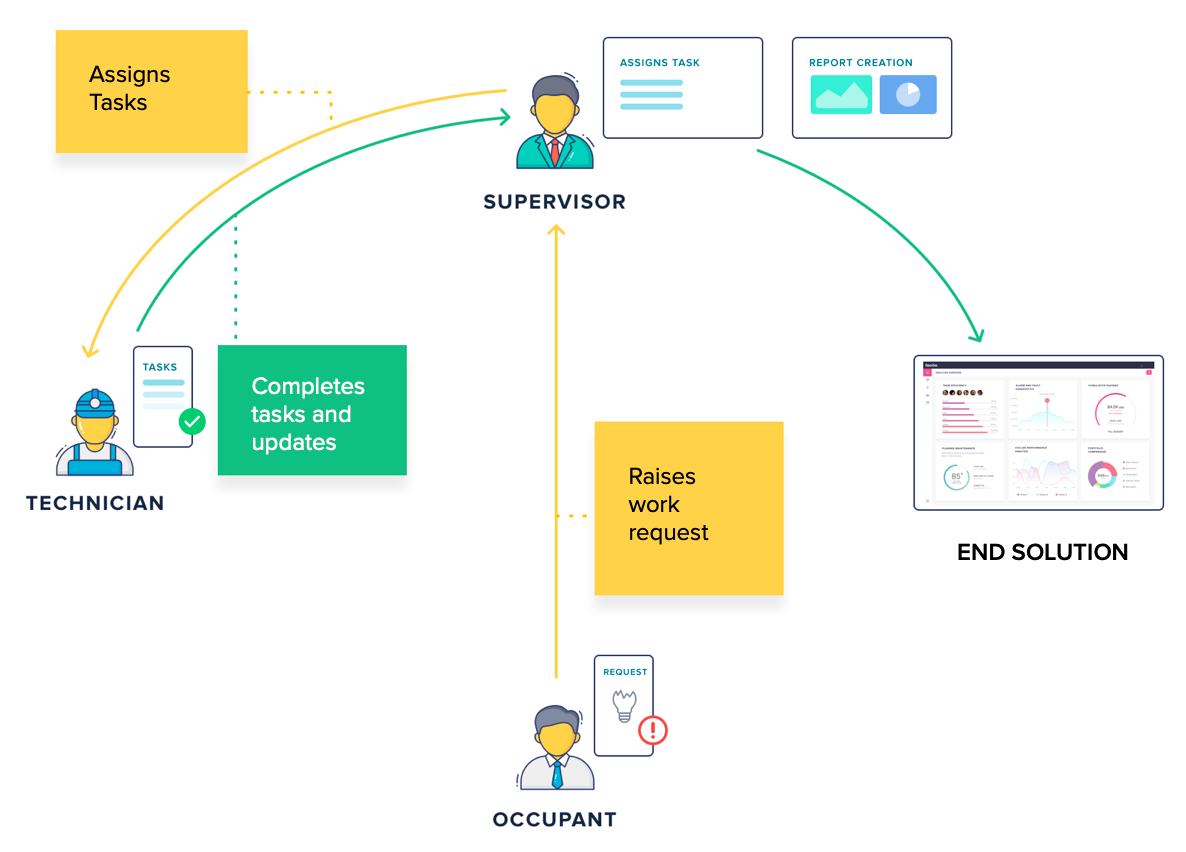
CAFM scenario user journey
One platform. Three experiences. Zero compromise.
The architecture centred on one shared data layer with role-specific UX surfaces. This design-systems approach kept interaction patterns consistent while respecting the very different contexts each user type works in.
Mobile App
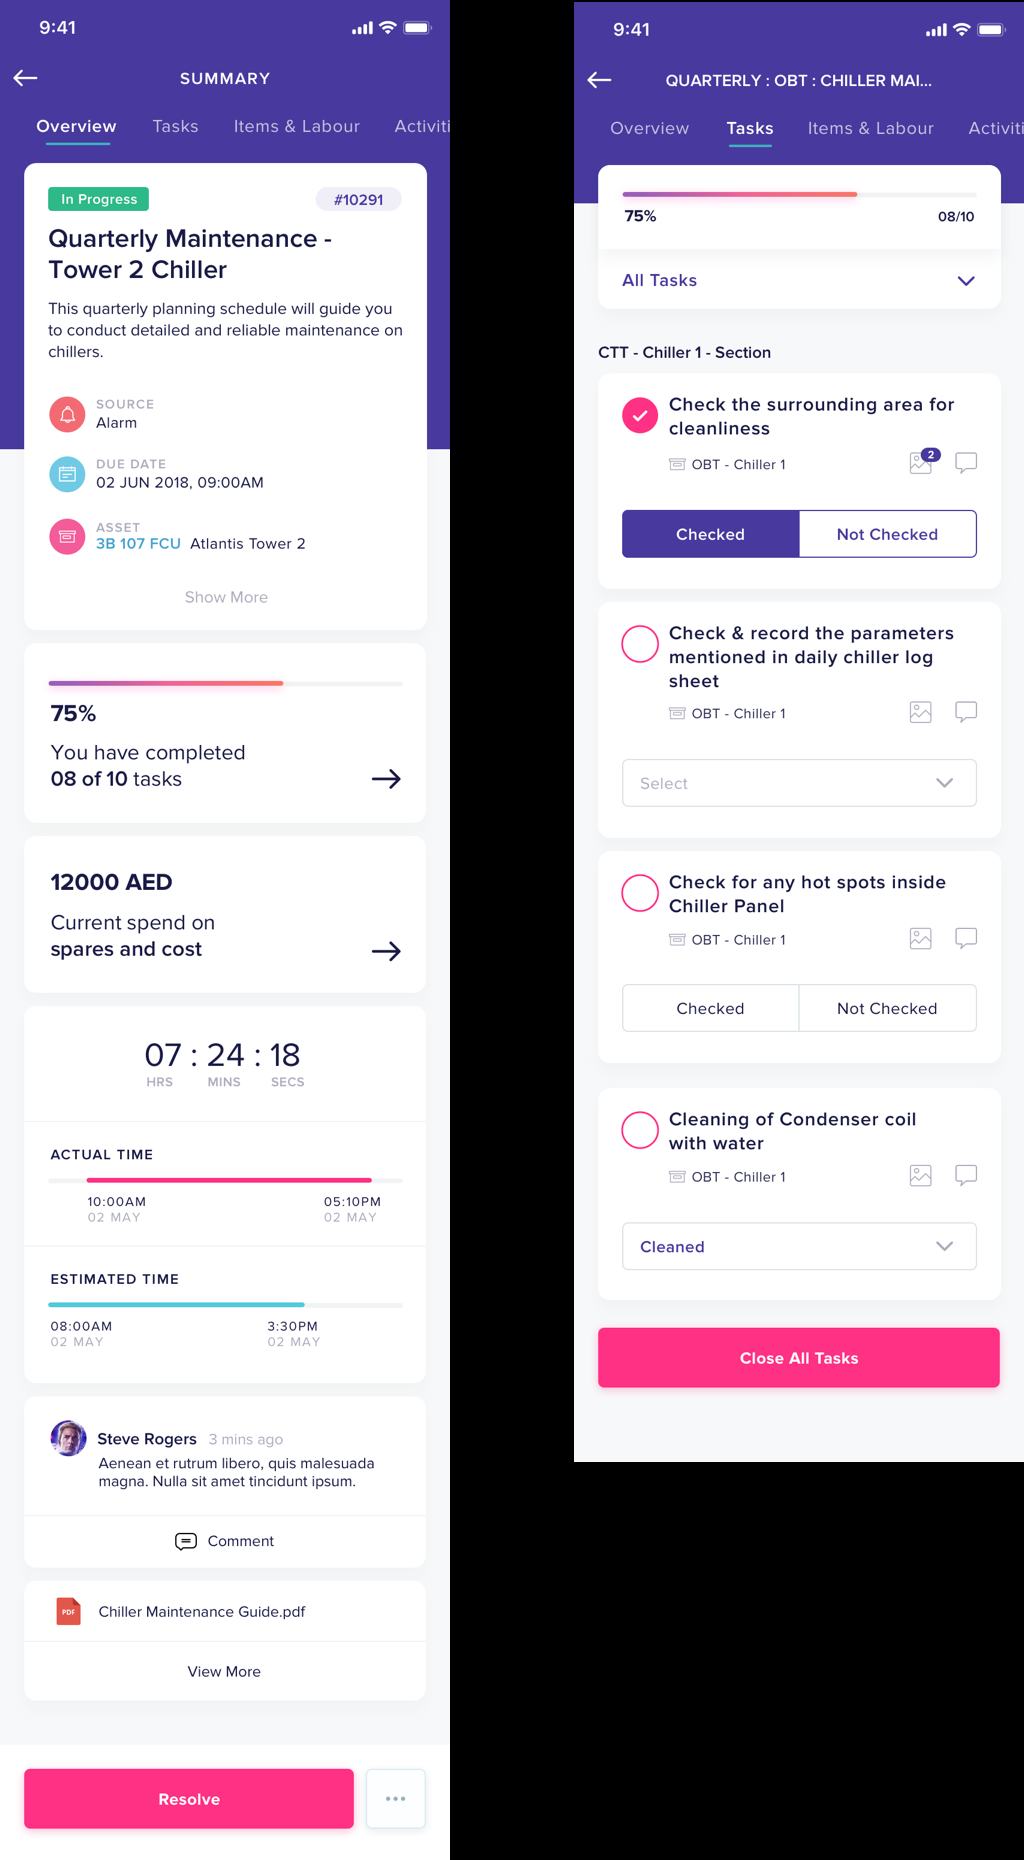
Built for clarity under pressure. A live progress bar shows task completion at a glance (e.g. 75%, 08 of 10 tasks). Estimated vs. actual time keeps schedules on track. Tasks check off with one tap, photos attach per task and meter readings go in inline, removing the errors that come with clipboards.
Web App
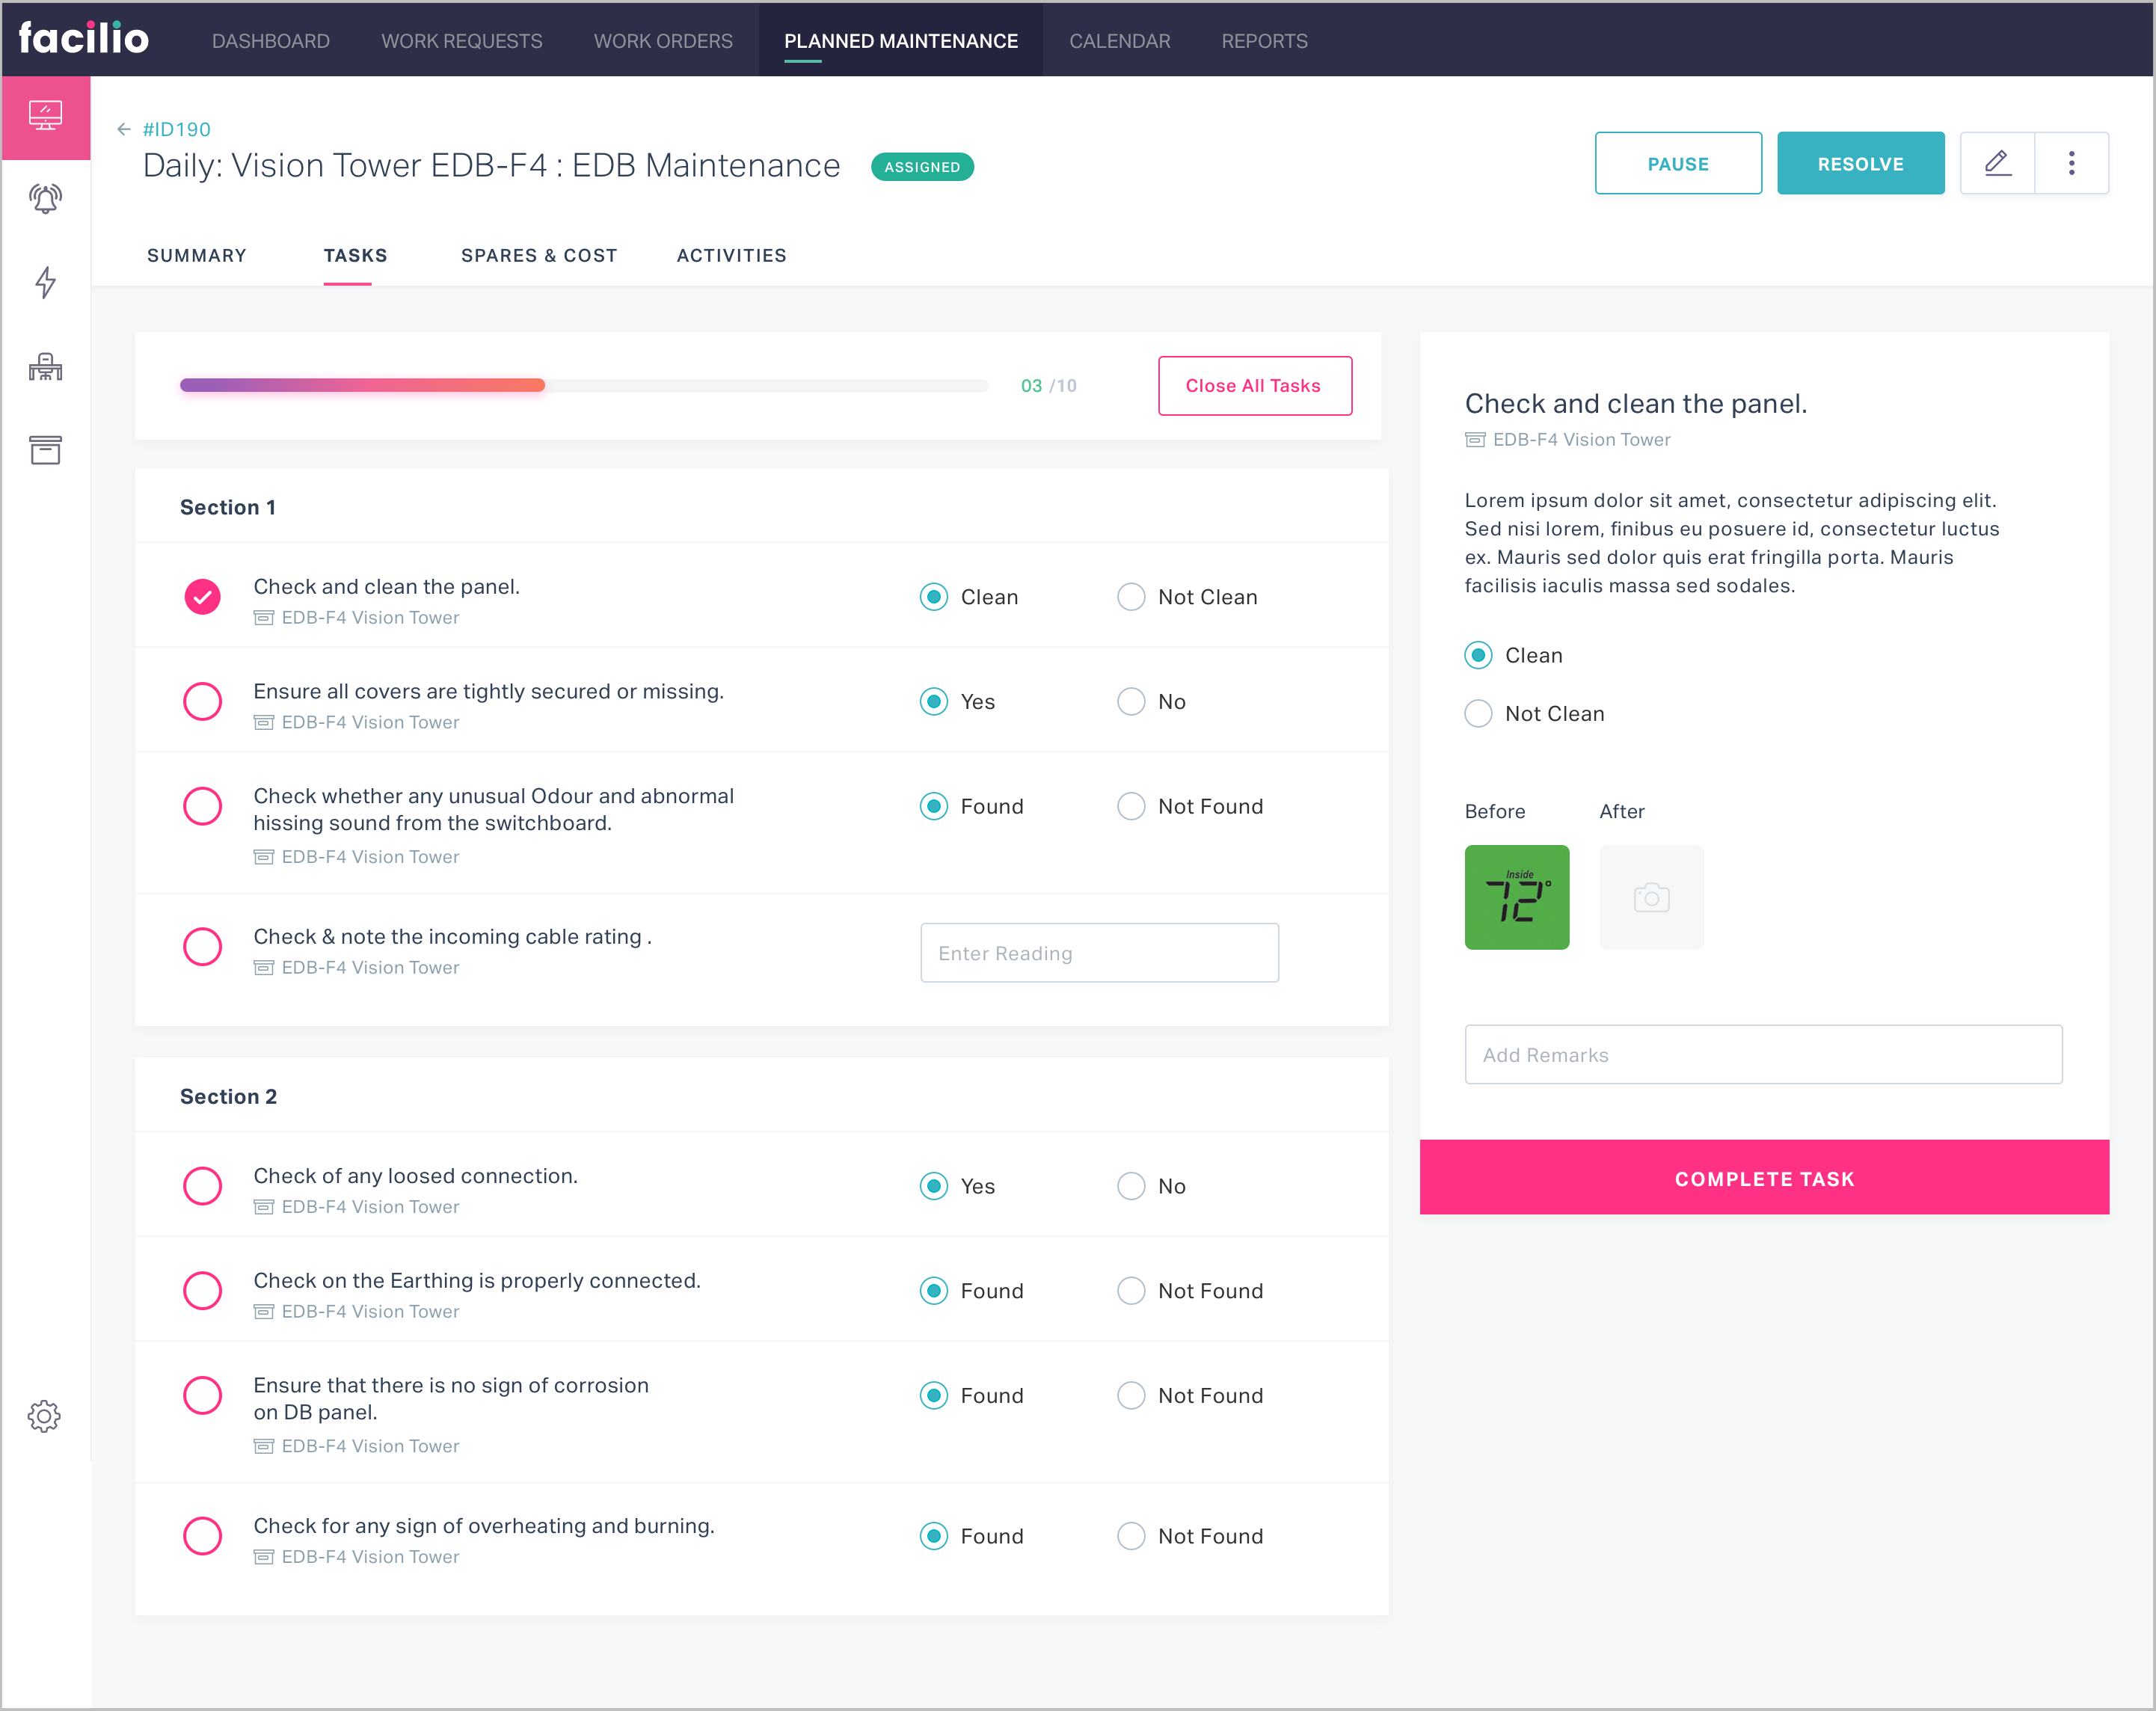
For desk-based work: structured task sections, inline reading entry with historical benchmarks visible ("Previous Reading: 819.89 kWh") and a persistent "Complete Task" CTA. Bulk task management, including copy-paste from Excel, cut data-entry time dramatically.
Web Dashboard
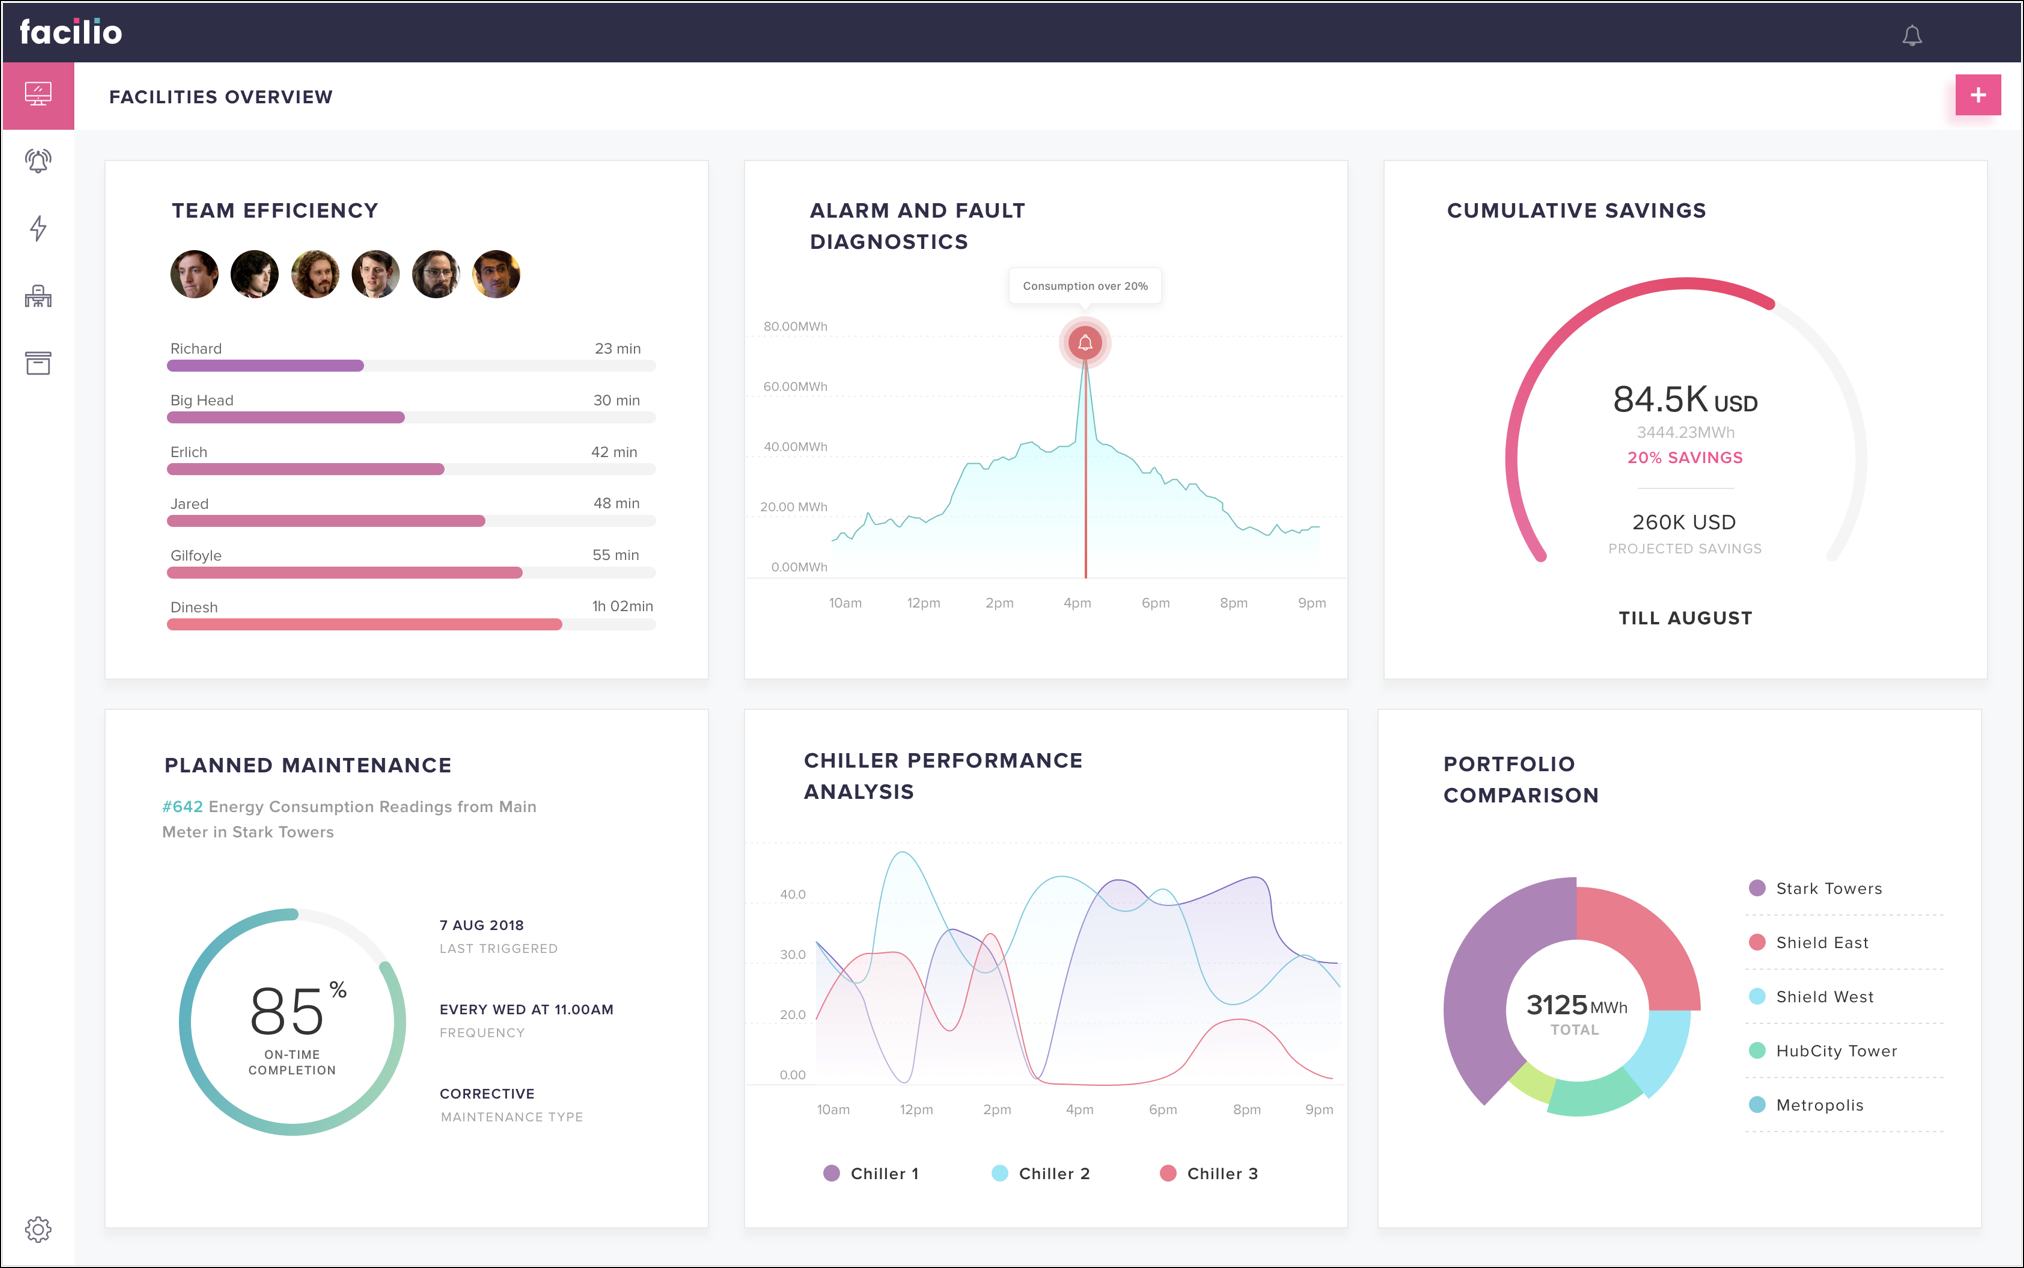
The operational command centre. A fully customisable layout shows Team Efficiency rankings, Alarm & Fault Diagnostics, Cumulative Savings ($84.5K, 20% above projection), Chiller Performance and Portfolio Comparison, with no IT ticket needed. On-time completion for planned maintenance (85%) is visible at a glance.
Portal & Controls
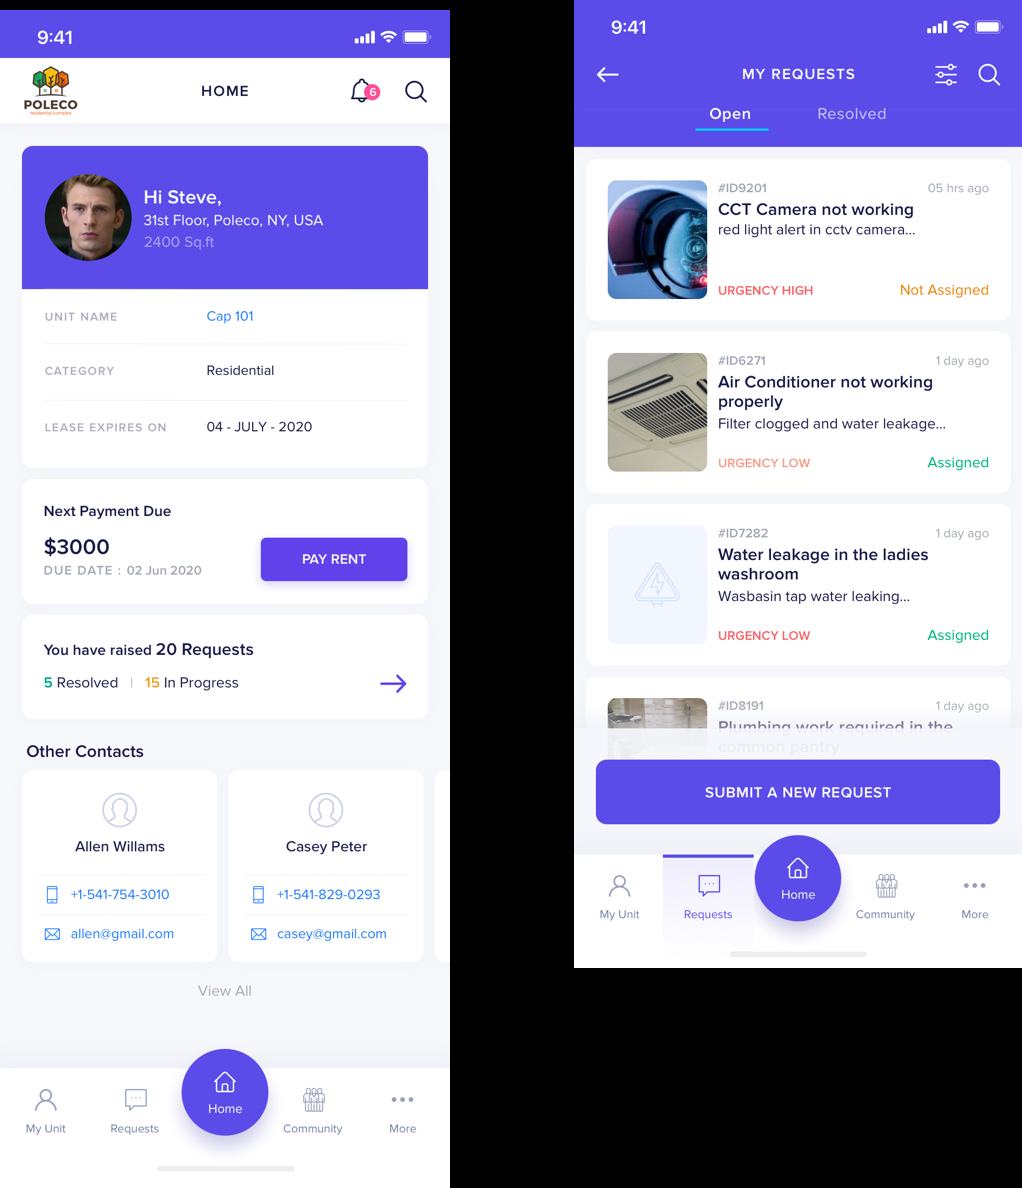
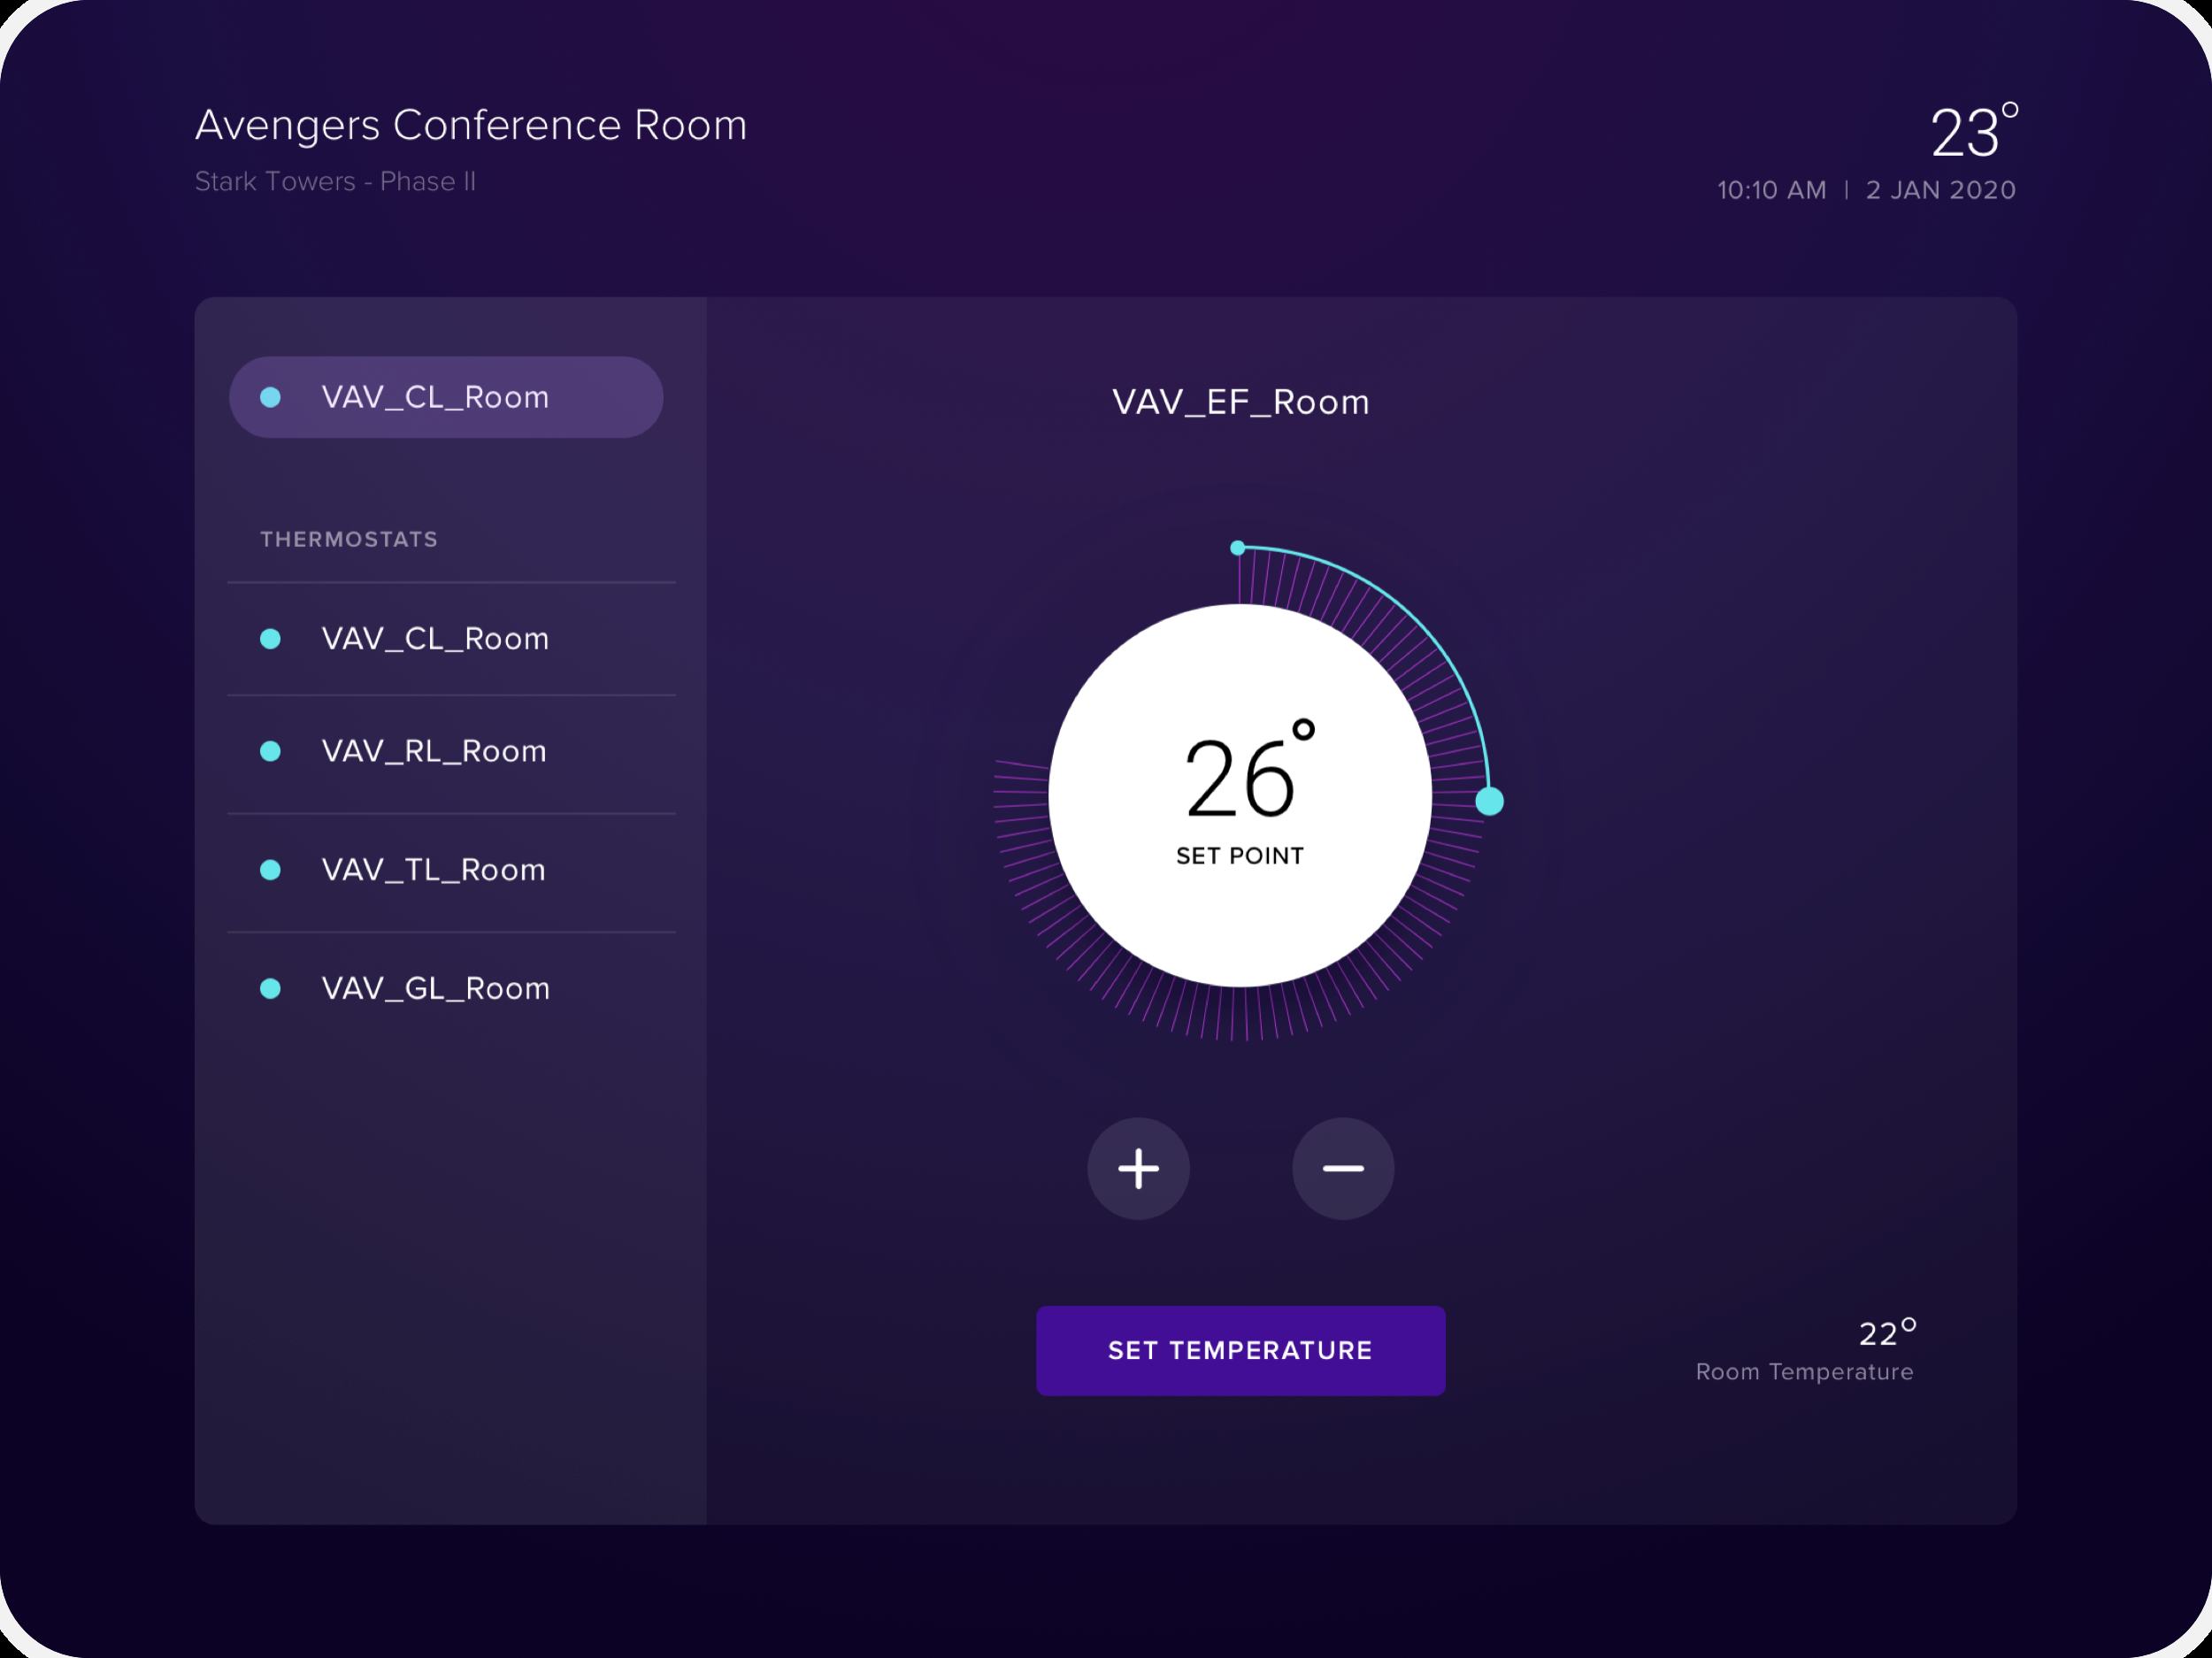
The occupant portal shows the next payment due up front, open vs. resolved requests with urgency tags and a single-tap "Submit a New Request" CTA. Real-time status updates ended follow-up calls. IoT controls for lighting and thermostats link the software to physical building systems.
Our partnership with Facilio is in line with our efforts to achieve optimal efficiency of energy consumption and operations across our facilities. Rami Alaileh · AVP Destination Management, Dubai World Trade Centre
Measurable outcomes across platform & portfolio
The design work went beyond aesthetics. It drove operational, financial and strategic results for customers managing hundreds of millions of square feet worldwide.
Sq ft managed: global portfolio scale
Properties across all verticals
Energy savings via Connected Buildings
On-time completion of planned maintenance
Paper to real-time
Manual checklists and clipboard readings gave way to mobile-first task management with live progress, photo evidence and digital readings against historical benchmarks.
Reactive to proactive
Disconnected tools and spreadsheet reports were replaced by a unified dashboard with team efficiency, alarm diagnostics, energy data and customisable KPIs.
Calls to one tap
Untracked email and phone requests became one-tap submission, urgency-tagged lists and real-time status updates.
Visibility at scale
Portfolio-wide operational visibility, IoT-connected controls, AI-driven fault detection and a 15–30% reduction in energy costs.